Stock trading signals that maximize return & minimize downside risk
Background: The investment industry manages funds in excess of $60tn globally. Managers of ‘Active’ funds seek to deliver a return in excess of the broad market and charge fees of 0.3- 1.0% per annum, whereas ‘passive’ funds use models which track indices and carry much lower fees. In recent years, there has been a trend towards designing hybrid ‘enhanced index’ or ‘index-plus’ funds with a similar cost to index-trackers, but with some of the upside potential of the active funds. OptiRisk has adopted this and built its own stock trading signals product.
To date alternative strategies have either used popular portfolio construction methods with oversimplified risk models (mean variance optimization on tracking error), or have used more sophisticated risk models (simulation-based) but have had to adopt weaker portfolio construction methods.
Our Approach: SES (Sentiment Enhanced Signals) uses a second-order stochastic dominance (SSD) approach suitable for all asset classes in all market conditions. Through extensive backtesting (with transaction costs), we demonstrate superior portfolio construction performance across markets, regimes and time periods.
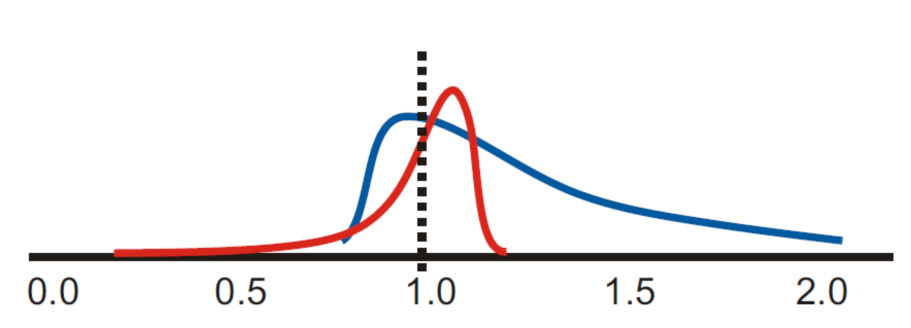
Whilst being computationally intensive, SES also ensures that the cumulative return across all market conditions (points on the distribution) dominates, that is, performs better than the index in many ways. Competing approaches simplify the true distribution of market returns leading to increased realized risk or underperformance.

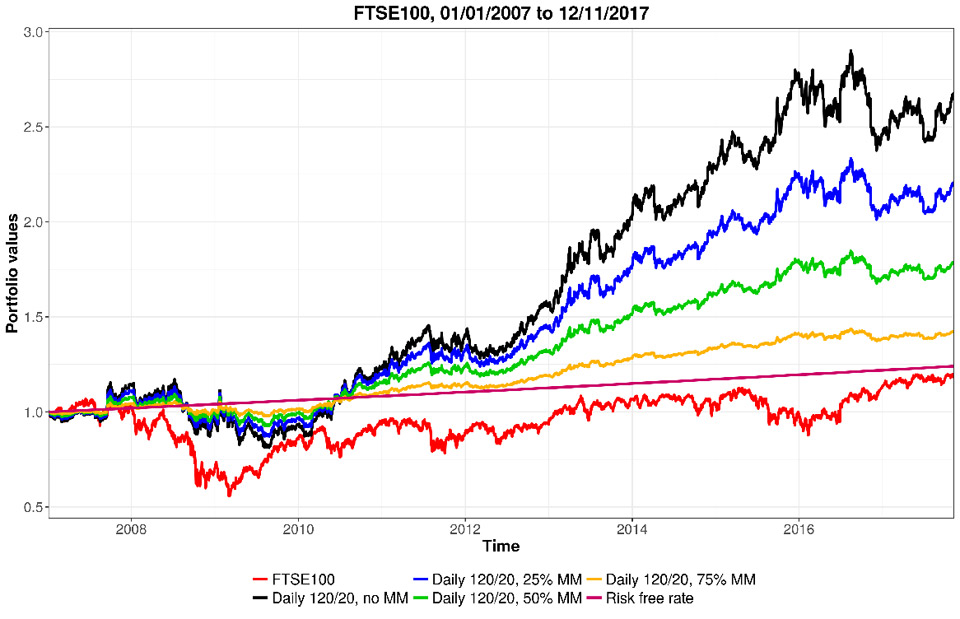
The accompanying graph below shows the performance of four trade portfolios against the index FTSE 100, from 2007-2017. The asset universe comprises of all constituents from FTSE 100 plus the index future. The four portfolios chosen by SES differ by the money management feature, which transforms it into a dynamic trading/asset allocation strategy. Their performance not only beats the index in terms of return, but also significantly minimizes downside risk and reduces drawdown. The performance table also sets out a compelling case.
Further results are available for EUROSTOXX 50, Hang Seng 50, S&P 500 and NIFTY 50. Visit our library of performance results: Trade SES.

| Portfolio | Final value | Excess RFR (%) | Sharpe ratio | Sortino ratio | Max draw- down (%) | Max. rec. days | Beta | Av. turnover |
|---|---|---|---|---|---|---|---|---|
| FTSE100 | 1.18 | -0.47 | -0.02 | -0.03 | 47.83 | 1495 | ||
| Daily 120/20, no MM | 2.66 | 7.41 | 0.43 | 0.62 | 30.71 | 548 | 0.28 | 19.25 |
| Daily 120/20, 25% MM | 2.20 | 5.51 | 0.43 | 0.62 | 23.23 | 516 | 0.21 | 14.43 |
| Daily 120/20, 50% MM | 1.78 | 3.47 | 0.41 | 0.59 | 15.40 | 508 | 0.14 | 9.62 |
| Daily 120/20, 75% MM | 1.42 | 1.31 | 0.31 | 0.44 | 7.27 | 484 | 0.07 | 4.81 |
